Quick Summary
Summarize this article instantly with your preferred AI model.
LinkedIn MCP Cross-Platform Attribution: How LinkedIn Creates Demand That Google Captures (2026)
20-40% of Google branded search pipeline in B2B SaaS has a LinkedIn touchpoint upstream — meaning LinkedIn creates demand that Google captures weeks or months later, but native platform tracking can’t see this cross-platform journey. MCP (Model Context Protocol) is an architecture that connects LinkedIn Ads + Google Ads + HubSpot into one analytics layer, revealing the full buyer journey: LinkedIn impression on Monday → category research Tuesday-Friday → Google branded search the following week → demo request → closed-won 90-180 days later. Without MCP, you see two disconnected stories: LinkedIn with high CPL and low ROAS, Google with low CPL and high ROAS. With MCP, you see one story: LinkedIn creates demand, Google captures it, combined system produces 4.5-8.5x ROAS at 180 days. The attribution dashboard tracks 6 metrics by LinkedIn campaign: sourced pipeline, influenced pipeline, cohort ROAS, Google branded search lift, cost per SQL combined, deal size premium. Most B2B SaaS companies running both channels in silos waste 20-40% of combined budget through duplicate attribution, conflicting optimization, and missed cross-platform signals.
Key Takeaways
- 20-40% of Google branded search pipeline has a LinkedIn touchpoint upstream (cross-platform reality).
- LinkedIn creates demand; Google captures it 30-90 days later — combined ROAS 4.5-8.5x at 180 days.
- MCP (Model Context Protocol) connects LinkedIn + Google + HubSpot for unified attribution.
- Native platform tracking can’t see the cross-platform journey.
- Single-platform tracking gives 3 disconnected dashboards; MCP gives 1 buyer journey.
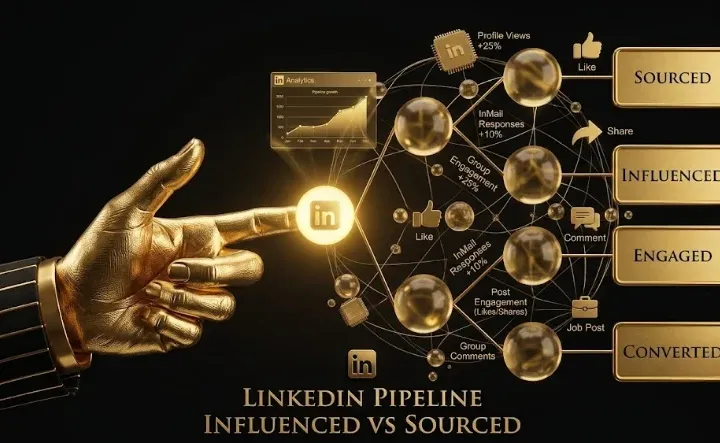
- 6-metric attribution dashboard: sourced + influenced + cohort ROAS + Google brand lift + combined CPS + deal size premium.
- Running channels in silos wastes 20-40% of combined budget through misaligned optimization.
The Cross-Platform Reality: How B2B Buyers Actually Buy
The typical B2B SaaS buyer journey:
Week 1: VP of Marketing sees LinkedIn thought leadership ad. Doesn’t click. Doesn’t remember the brand name. Moves on.
Week 2: Same VP sees the same brand on a different LinkedIn ad. Pattern recognition starts. Vague familiarity builds.
Week 4: VP sees a third ad with case study data. Brain logs “this company helped [similar company] solve [my problem].” Still doesn’t click.
Week 7: Internal pressure on the problem mounts. VP types brand name into Google. Clicks the top result. Reads website. Books demo.
Day 281: Deal closes.
The attribution problem:
- LinkedIn’s native tracking: 0 clicks, 0 conversions, 0 attributed pipeline. LinkedIn looks unprofitable.
- Google’s native tracking: 1 branded search → 1 demo → 1 closed-won deal. Google gets 100% credit.
- HubSpot tracking: Lead source = “Google Ads” or “Organic Search”. LinkedIn invisible.
LinkedIn created the demand. Google captured it. Native tracking credits Google for both.
The strategic disaster:
CMO sees LinkedIn at 0.4x ROAS and Google at 4x ROAS. Logical decision: cut LinkedIn, scale Google.
6 months later: pipeline crashes. The demand-creation engine has been killed. Google has nothing left to capture.
This is the cross-platform attribution problem MCP solves.
What MCP Actually Is
MCP (Model Context Protocol) is an architecture for connecting multiple data systems into one analytics layer.
For B2B SaaS attribution, MCP connects:
- LinkedIn Ads Campaign Manager API
- Google Ads API
- HubSpot CRM (or Salesforce)
- Optional: Meta Ads, Webflow, Snowflake, custom analytics
What MCP enables:
| Capability | What It Reveals |
|---|---|
| Cross-platform path tracking | LinkedIn impression → Google branded search → demo → closed-won |
| Multi-touch attribution | Credit distribution across LinkedIn + Google + organic |
| Cohort-based ROAS | LinkedIn cohort revenue at 90/180/365 days |
| Pipeline influence reporting | LinkedIn-influenced pipeline (not just sourced) |
| Channel ROI comparison | True channel contribution (not platform-reported numbers) |
| Combined cost per SQL | LinkedIn + Google blended efficiency |
| Campaign-level pipeline data | Which specific LinkedIn campaigns create downstream conversions |
The architecture in plain terms:
Imagine three dashboards that don’t talk to each other:
- LinkedIn dashboard (shows clicks/CPL on LinkedIn only)
- Google dashboard (shows clicks/conversions on Google only)
- HubSpot dashboard (shows deals with single-source attribution)
MCP creates a fourth layer that pulls from all three, matches users across platforms (via emails, company domains, HubSpot contacts), and shows the unified journey.
The 20-40% Cross-Platform Influence Stat
Per analysis of B2B SaaS accounts running both LinkedIn and Google:
Average finding: 20-40% of Google branded search pipeline has a LinkedIn touchpoint upstream.
Variance by ACV tier:
| ACV Range | % of Google Brand Pipeline With LinkedIn Touch |
|---|---|
| Sub-$10K ACV | 10-20% |
| $10K-$30K ACV | 20-30% |
| $30K-$75K ACV | 30-40% |
| $75K-$150K ACV | 35-45% |
| $150K-$500K ACV | 40-55% |
| $500K+ ACV (enterprise) | 50-65% |
Pattern: Higher ACV = stronger LinkedIn-Google relationship. Enterprise buyers research extensively on LinkedIn before searching brand names on Google.
The implication for attribution:
A $100K ACV B2B SaaS company seeing:
- Google branded search: 100 conversions/month
- 35-45% LinkedIn influence = 35-45 of those conversions had a LinkedIn touchpoint
If LinkedIn budget gets cut, those 35-45 conversions don’t move to Google. They simply stop happening — because LinkedIn was the demand creation that led to the Google search.
The Single-Platform Tracking Trap
Why native platform tracking fails:
LinkedIn Campaign Manager limitations:
- Tracks last-click conversions on LinkedIn only
- View-through conversions limited to LinkedIn members (not cross-platform)
- 30-day default attribution window (sales cycles are 281 days)
- Can’t see downstream Google or organic conversions
- Conversion data limited to form fills + page visits
Google Ads limitations:
- Tracks last-click conversions from Google
- Sees branded search but doesn’t know what created the brand awareness
- Can’t see LinkedIn impressions that preceded the search
- Conversion attribution gives full credit to Google for closed-won deals
HubSpot limitations:
- Single-source attribution (Lead Source field shows ONE channel)
- Multi-touch attribution requires upgrade + configuration
- Can’t see ad impressions (only clicks/form fills)
- Often shows “Organic Search” or “Direct” for what was actually LinkedIn-influenced
The compound effect:
Each platform tells its own story. LinkedIn says “we drove engagement.” Google says “we drove conversions.” HubSpot says “deals came from organic/direct.” All three are partially true and entirely misleading.
The real story is invisible without cross-platform connection.
The 6-Metric MCP Dashboard
When properly implemented, MCP attribution surfaces 6 key metrics by LinkedIn campaign, audience, and creative:
Metric 1: LinkedIn-Sourced Pipeline
Definition: Deals where LinkedIn was the first or last touch (direct attribution).
Typical value: 20-30% of LinkedIn’s total contribution.
Purpose: Validates direct LinkedIn ROI for executive reporting.
Metric 2: LinkedIn-Influenced Pipeline
Definition: Deals where LinkedIn was ANY touchpoint (multi-touch attribution).
Typical value: 3-5x larger than sourced pipeline. Often 50-90% of total LinkedIn contribution.
Purpose: Reveals actual marketing contribution beyond first/last touch attribution.
Metric 3: Cohort-Based ROAS
Definition: Monthly cohorts measured at 90/180/365 days post-lead generation.
Typical values: 30-day 0.3-0.5x → 90-day 1-2x → 180-day 4-8x → 365-day 6-12x.
Purpose: Accounts for long B2B sales cycles; reveals true ROI.
Metric 4: Google Branded Search Lift
Definition: Google branded search volume change correlated with LinkedIn campaign activity.
Typical value: 15-40% lift in Google branded search 30-90 days after LinkedIn campaigns launch.
Purpose: Measures LinkedIn’s demand creation effect on Google capture.
Metric 5: Combined Cost per SQL
Definition: LinkedIn Ad Spend + Google Ad Spend ÷ SQLs attributed to either channel.
Typical value: Combined CPS often 30-50% lower than either platform’s reported CPS.
Purpose: Reveals true cost per SQL when both platforms work as one system.
Metric 6: Deal Size Premium
Definition: LinkedIn-sourced/influenced deal size vs Google-sourced/influenced deal size.
Typical value: LinkedIn-touched deals are 28.6-35% larger than Google-only deals.
Purpose: Reveals LinkedIn’s role in attracting higher-ACV buyers.
How MCP Reveals Hidden Pipeline
Real-world MCP discoveries:
Discovery 1: The “Direct Traffic” Trap
Without MCP: HubSpot shows 200 leads/month from “Direct Traffic.” Lead Source attribution is generic.
With MCP: 60-80% of “Direct Traffic” leads first saw LinkedIn ads. LinkedIn drove the brand recognition that produced direct visits. LinkedIn deserves credit for ~120-160 of those 200 leads.
Discovery 2: The Brand Search Underground
Without MCP: Google brand search appears organic and free. Marketing assumes brand search is “earned” through PR, content, organic SEO.
With MCP: 20-40% of brand search comes from LinkedIn awareness campaigns. LinkedIn is the primary driver of brand search volume, not organic content.
Discovery 3: The Cross-Channel Synergy
Without MCP: LinkedIn ROAS 0.5x at 30 days, Google ROAS 4x at 30 days. Conclusion: scale Google, cut LinkedIn.
With MCP: LinkedIn + Google combined ROAS 4.5-8.5x at 180 days, with LinkedIn driving the high-ACV deals that Google captures. Conclusion: increase BOTH, coordinate creative.
Discovery 4: The Audience Quality Surprise
Without MCP: LinkedIn CPL $200, Google CPL $80. Looks like Google is 2.5x more efficient.
With MCP: LinkedIn leads have 35% higher ACV, 18% better win rate, 25% better retention. Per-dollar-of-pipeline, LinkedIn often beats Google.
How to Implement Cross-Platform Attribution
Phase 1: Infrastructure (Weeks 1-2)
Required:
- LinkedIn Ads CAPI installed
- Google Ads Enhanced Conversions enabled
- HubSpot multi-touch attribution configured
- Cross-platform identity resolution (email/company-based matching)
Phase 2: MCP Connection (Weeks 2-3)
Options:
- Built tool: OLA, Synter, custom MCP server
- Manual stitching: BigQuery + dbt + Looker (engineering-heavy)
- Attribution platform: Dreamdata, HockeyStack, Bizible (enterprise pricing)
Phase 3: Dashboard Building (Weeks 3-4)
Build dashboards for:
- LinkedIn campaign → Google branded search lift
- Cross-platform path analysis
- Combined cost per SQL
- LinkedIn-sourced + influenced pipeline
- Cohort ROAS at multiple windows
- Deal size by channel touchpoint
Phase 4: Decision Cadence (Ongoing)
Monthly review:
- Which LinkedIn campaigns produced Google brand search 30-90 days later?
- What’s the cross-platform path for closed-won deals?
- Are we coordinating creative across platforms?
- Should budget shift between channels based on combined data?
When MCP Cross-Platform Attribution Matters Most
| Scenario | Why MCP Critical |
|---|---|
| Running both LinkedIn + Google Ads | Without MCP, can’t see how they work together |
| High ACV ($75K+) | Enterprise buyers heavily research LinkedIn before Google search |
| Long sales cycles (200+ days) | Native tracking misses cross-platform sequence |
| Sophisticated CRM (HubSpot/Salesforce) | Data exists; needs unified layer |
| Strategic budget decisions | Can’t allocate intelligently without true attribution |
| CMO measuring multi-channel ROI | Required for accurate channel comparison |
When MCP is less critical:
- Single-channel programs (LinkedIn only OR Google only)
- Short sales cycles (sub-30 days)
- Pre-PMF startups with minimal volume
- Sub-$10K ACV where journey is shorter
- Single-stakeholder buyers (no committee dynamics)
Common Cross-Platform Attribution Mistakes
Mistake 1: Measuring LinkedIn and Google separately. Each platform’s native dashboard tells a misleading story. Always measure as unified system through MCP or equivalent.
Mistake 2: Cutting LinkedIn based on its standalone ROAS. LinkedIn 0.5x at 30 days looks bad. Combined LinkedIn + Google at 4.5-8.5x at 180 days looks great. Decision-making requires combined data.
Mistake 3: Last-click attribution. Gives Google 100% credit for closed-won deals that LinkedIn started. Position-based (40/40/20) is minimum. Data-driven attribution is better.
Mistake 4: Not running cross-platform creative coordination. LinkedIn awareness creative → Google brand search → Google search retargeting → demo. Without coordination, creative is disconnected.
Mistake 5: Two agencies running each platform. LinkedIn agency optimizes LinkedIn. Google agency optimizes Google. Neither optimizes the SYSTEM. Cross-platform attribution requires unified management.
Mistake 6: Skipping the infrastructure. MCP attribution requires CAPI, Enhanced Conversions, HubSpot multi-touch. Without these foundations, MCP can’t see the journey.
Mistake 7: Reporting platform metrics to executives. “LinkedIn CPL $200” tells the wrong story. “LinkedIn-influenced pipeline + 28.6% deal size premium” tells the right story.
Mistake 8: One-time attribution analysis. Cross-platform patterns shift as audiences, creative, and competition evolve. Quarterly attribution review keeps insights current.
How OLA Implements MCP Attribution
OLA’s optimization layer includes cross-platform attribution:
- Multi-platform connection — LinkedIn + Google + HubSpot in unified dashboard
- Cross-platform path tracking — LinkedIn impression → Google brand search → demo journey
- Google branded search lift measurement — correlates LinkedIn campaign activity with brand search volume
- Cohort ROAS calculation — monthly cohorts at 90/180/365-day intervals
- LinkedIn-sourced + influenced pipeline reporting — separates both attribution dimensions
- Combined cost per SQL — true blended efficiency across channels
Flat $29/month per Ad Account. 15-minute setup. Works for B2B SaaS teams running both LinkedIn + Google.
For teams that want senior operators designing + maintaining cross-platform attribution + budget allocation + creative coordination, GrowthSpree’s managed service wraps OLA into a $3,000/month flat engagement — month-to-month, HubSpot-native.
FAQs
What is MCP cross-platform attribution for LinkedIn Ads?
MCP (Model Context Protocol) is an architecture connecting LinkedIn Ads + Google Ads + HubSpot into one analytics layer. Reveals cross-platform journey: LinkedIn impression → category research → Google branded search → demo → closed-won. Without MCP, three disconnected dashboards (each platform’s native tracking) tell partial stories. With MCP, one unified buyer journey emerges. 20-40% of Google branded search pipeline has a LinkedIn touchpoint upstream — invisible to native platform tracking.
What percentage of Google branded search has LinkedIn influence?
20-40% of Google branded search pipeline has a LinkedIn touchpoint upstream in B2B SaaS. Variance by ACV: sub-$10K ACV 10-20%, $10K-$30K 20-30%, $30K-$75K 30-40%, $75K-$150K 35-45%, $150K-$500K 40-55%, $500K+ enterprise 50-65%. Pattern: higher ACV = stronger LinkedIn-Google relationship because enterprise buyers research extensively on LinkedIn before searching brand names on Google. The 20-40% figure means cutting LinkedIn budget kills 20-40% of Google brand search performance.
Why does LinkedIn look unprofitable in native tracking?
LinkedIn Campaign Manager tracks last-click conversions on LinkedIn only with 30-day default window. B2B SaaS sales cycles average 281 days (Dreamdata 2026). Native tracking misses: cross-platform conversions (LinkedIn → Google), 281-day cycle (vs 30-day window), view-through conversions outside LinkedIn, multi-channel journeys with multiple touchpoints. Result: LinkedIn shows 0.3-0.5x ROAS at 30 days despite producing 4.5-8.5x combined ROAS at 180 days when measured with cross-platform attribution.
How do I set up cross-platform LinkedIn-Google attribution?
4 phases: (1) Infrastructure (weeks 1-2) — LinkedIn CAPI installed, Google Enhanced Conversions enabled, HubSpot multi-touch attribution configured, cross-platform identity resolution, (2) MCP connection (weeks 2-3) — OLA, Synter, custom MCP server, or attribution platform (Dreamdata, HockeyStack), (3) Dashboard building (weeks 3-4) — LinkedIn-Google brand lift, cross-platform paths, combined CPS, sourced + influenced pipeline, cohort ROAS, deal size by channel touchpoint, (4) Decision cadence (monthly) — review patterns and adjust budget allocation.
What’s the difference between LinkedIn-sourced and LinkedIn-influenced pipeline?
LinkedIn-sourced: Deals where LinkedIn was the first or last touch (last-click or first-click attribution). Captures 20-30% of LinkedIn’s total contribution. LinkedIn-influenced: Deals where LinkedIn was ANY touchpoint (multi-touch attribution). Captures 50-90% of LinkedIn’s actual contribution — 3-5x larger than sourced. The gap matters because most B2B journeys have 4+ channel touchpoints; sourced metrics undercredit LinkedIn by 3-5x. Always report both: sourced for direct attribution, influenced for full contribution.
What 6 metrics should be on a cross-platform attribution dashboard?
(1) LinkedIn-Sourced Pipeline — first/last touch attribution, (2) LinkedIn-Influenced Pipeline — multi-touch attribution, (3) Cohort-Based ROAS at 90/180/365 days — handles long cycles, (4) Google Branded Search Lift — 15-40% lift correlated with LinkedIn campaigns, (5) Combined Cost per SQL — LinkedIn + Google combined efficiency, (6) Deal Size Premium — LinkedIn-touched deals are 28.6-35% larger. Each metric reveals a different dimension of cross-platform value. All 6 needed for complete picture.
When is MCP cross-platform attribution most important?
Critical for: running both LinkedIn + Google (can’t see how they work together without MCP), high ACV ($75K+) where enterprise buyers heavily research LinkedIn before Google search, long sales cycles (200+ days) where native tracking misses sequence, sophisticated CRM where data exists but needs unified layer, strategic budget decisions, CMO measuring multi-channel ROI. Less critical for: single-channel programs, short cycles (sub-30 days), pre-PMF startups, sub-$10K ACV products, single-stakeholder buyers.
What’s the combined LinkedIn + Google ROAS for B2B SaaS?
Combined LinkedIn + Google ROAS averages 4.5-8.5x at 180 days for B2B SaaS, vs individual platform ROAS of LinkedIn 0.5x and Google 4x at 30 days. The dramatic difference: cross-platform attribution credits LinkedIn for demand creation that Google captures later. Without MCP, marketers see LinkedIn at 0.5x and conclude it’s failing — cutting budget and killing the demand engine. With MCP, they see the unified 4.5-8.5x combined ROAS and scale both channels coordinatedly.
Set Up Cross-Platform Attribution
Connect OLA + HubSpot. The dashboard surfaces LinkedIn-influenced Google brand search, cross-platform paths, combined cost per SQL, and 28.6-35% deal size premium for LinkedIn-touched deals. Most B2B SaaS discover their LinkedIn ROI is 5-10x higher when measured cross-platform — making this the highest-leverage attribution improvement.