Quick Summary
Summarize this article instantly with your preferred AI model.
LinkedIn Ads Engagement Rate: What It Is and What Is Good
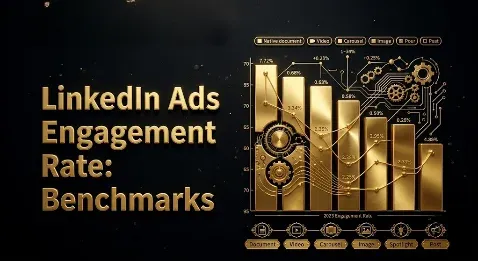
LinkedIn Ads Engagement Rate: What It Is and What Is Good
LinkedIn ads engagement rate is the share of impressions that produced an interaction, calculated as total engagements, which means clicks plus reactions, comments, shares, follows, and “see more” expansions, divided by impressions. There is no single good number, because it swings hard by format: single image ads run around 1%, while document, video, and thought leader ads run 5 to 6% or higher. What matters is what the metric is actually for. Engagement rate measures creative quality and relevance, and it feeds the relevance score that lowers your cost, but it is not a success metric. A high engagement rate with no pipeline means your creative is entertaining, not persuasive. This guide covers how engagement rate is calculated, benchmarks by format, how it differs from click-through rate, and how to use it without mistaking it for results.
Key takeaways
- Engagement rate is total engagements (clicks plus reactions, comments, shares, follows, and “see more” expansions) divided by impressions, so it is always higher than click-through rate, which counts clicks only.
- There is no universal benchmark: single image ads run about 1%, while document ads (around 6%), multi-image (around 6.6%), video (around 5.6%), and thought leader ads (around 5% and often far higher) run much higher.
- A “good” engagement rate of 5% or more mostly reflects social-action-heavy formats, so compare like format to like format and against your own account’s trend.
- Engagement rate feeds the relevance score that raises your ad rank and lowers your CPC, so it is a cost lever and a creative diagnostic, not a goal.
- Not all engagements are equal: likes and “see more” clicks rarely signal intent, so judge campaigns on cost per qualified lead and read engagement against conversion.
What is LinkedIn ads engagement rate?
Engagement rate is the percentage of impressions that produced some interaction with your ad. LinkedIn counts a wide range of interactions as engagements: chargeable clicks (to your landing page or lead form), social clicks (likes, comments, shares), clicks that expand the intro text (“see more,” which appears once your text runs past roughly 160 characters), clicks to your company page or to view more of a carousel or document, and follows. Add them all up, divide by impressions, and you have engagement rate. You will find it in Campaign Manager by switching the columns view to Engagement. Because it sweeps in every kind of interaction, not just the click that costs you money, it is the broadest measure of whether an ad is landing with the audience at all. It answers one question well, “are the right people reacting to this creative,” and it answers the business question, “is this producing pipeline,” not at all.
How is engagement rate calculated?
The formula is straightforward:
Engagement rate = (clicks + reactions + comments + shares + follows + “see more” expansions) / impressions
Say an ad earns 50,000 impressions and collects 400 clicks, 350 reactions, 40 comments, 30 shares, and 80 follows. That is 900 engagements on 50,000 impressions, an engagement rate of 1.8%. Notice that only the chargeable clicks relate to cost; the other interactions are social actions you did not pay for directly. This is why engagement rate always sits above click-through rate for the same ad: CTR counts only the chargeable clicks, while engagement rate counts those plus every social action on top. LinkedIn reports both, so you can read them side by side.
What is a good LinkedIn ads engagement rate?
There is no single official benchmark, and the honest answer is that the format decides almost everything. Single image ads, the workhorse of most B2B accounts, tend to run around 1%, with observed figures as low as 0.5%. Formats that invite social actions run several times higher. The table below pulls together commonly cited figures.
| Format | Typical engagement rate |
|---|---|
| Thought leader ads | Around 5%, often much higher (up to the high teens) |
| Multi-image ads | Around 6.6% |
| Document ads | Around 5.9% to 6% |
| Video ads | Around 5.6% |
| Single image ads | Around 1% |
| Text and dynamic ads | Below 1% |
A “good” overall benchmark is often quoted as 5% or higher, but that figure is dominated by the social formats; for single image ads, 1 to 2% is normal and not a sign of failure. The practical takeaway, and the one most sources agree on, is that it is not helpful to hold every ad to one universal number. Compare like format to like format, and compare this month to last month in your own account, which is the only benchmark that controls for your audience and offer.
Engagement rate vs click-through rate
Engagement rate and click-through rate measure different things, and confusing them leads to bad decisions. Click-through rate counts only chargeable clicks divided by impressions, so it tracks the action you pay for, typically 0.44% to 0.65% for sponsored content, with 0.65% and up considered good. Engagement rate counts those clicks plus every social action, so it is always higher and tracks how much the ad resonated overall. Use CTR when you care about traffic and cost efficiency, because it maps to the click you pay for. Use engagement rate when you are diagnosing creative, because a high engagement rate with a low CTR tells you the ad is likeable but not compelling enough to pull the click. Neither one tells you whether a lead was qualified; that is what cost per lead and pipeline are for. This is why some performance teams optimize primarily around landing-page click-through rate rather than raw engagement, treating engagement as a secondary, diagnostic signal.
Why engagement rate matters, and where it does not
Engagement rate earns its place for one concrete reason: it feeds your relevance score. LinkedIn ranks ads in the auction on bid multiplied by relevance, and relevance is built partly from predicted engagement, the platform’s guess at how likely members are to interact. An ad that earns strong engagement signals high relevance, which raises its ad rank, which means it can win the auction at a lower bid and lower your effective cost per click. So engagement rate is not vanity in the way a raw follower count is; it has a direct line to what you pay.
Where it stops mattering is the moment you treat it as the goal. Engagement is interaction, not intent, and not all engagements are equal: a like or a “see more” expansion costs the viewer nothing and signals almost nothing about buying. A clever, funny, or provocative ad can earn a 10% engagement rate and zero qualified leads, because reacting to a post and booking a demo are different acts by, often, different people. The failure mode is optimizing creative toward engagement, which quietly pulls you toward entertaining the feed rather than persuading a buyer. Use engagement rate to protect your relevance score and diagnose creative, and judge the campaign on pipeline.
The engagement-versus-conversion matrix
The most useful way to read engagement rate is against conversion, not on its own. Cross the two and you get a simple diagnostic that tells you where the problem actually sits.
| High conversion | Low conversion | |
|---|---|---|
| High engagement | Creative and offer both working; scale it | Creative grabs attention but the offer, landing page, or targeting is off; fix those, not the ad |
| Low engagement | The right people convert despite dull creative; sharpen the creative to lower cost | Wrong audience or weak everything; rebuild the campaign |
The top-right quadrant is the one engagement rate alone would hide: a high engagement rate looks like success, but if conversion is low you have an ad that entertains the wrong people or sends them to a page that does not deliver. The bottom-left is the mirror image that pure engagement chasing would wrongly kill: unglamorous creative that quietly converts the right buyers. Read the two numbers together and you stop mistaking attention for results.
How do you improve engagement rate?
Improving engagement rate is mostly about relevance and format. Match the creative tightly to the specific audience, because a message written for one persona engages far better than a generic one stretched across several. Lead with a hook in the first line of the intro text, since that is what members see before the “see more” cut-off at around 160 characters. Test formats that naturally earn social actions, like thought leader ads, document ads, and video, when the goal is engagement and relevance rather than a hard conversion. Keep audiences tight so the ad reaches people it was written for. And refresh creative every three to four weeks, because engagement rate falls as an audience sees the same ad repeatedly and fatigue sets in. Each of these lifts engagement in a way that also improves relevance, so the gain shows up in your cost, not just the metric.
Common engagement-rate mistakes
The mistakes cluster at two extremes. On one side, advertisers chase engagement as the objective, optimizing toward reactions and comments until the creative is engagement bait that produces no pipeline. On the other side, advertisers ignore engagement rate entirely and miss that a weak score is dragging their relevance score down and inflating their CPC. In between sit two comparison errors: judging a sponsored ad’s engagement rate against organic post benchmarks, which run on different mechanics and higher numbers, and comparing engagement rates across formats as if a single image ad at 1% were failing next to a document ad at 6%. The fix for all four is the same discipline: read engagement rate as a relevance and creative signal, compare like with like, and keep your eyes on cost per qualified lead as the number that decides.
Read engagement rate as a signal, not a scoreboard
Here is the thread that ties it together. Engagement rate is worth watching because it reflects creative quality and feeds the relevance score that lowers your CPC, so a strong one makes your whole account cheaper to run. But it measures attention, not intent, and it swings so hard by format that a single number means little on its own. Compare it like format to like format, read it against conversion to find where a problem really sits, and judge the campaign itself on the cost per qualified lead and pipeline it produces. If you want your LinkedIn ads read for creative quality and pipeline rather than vanity metrics, you can book a demo.
Frequently Asked Questions
Q1. What is a good engagement rate for LinkedIn ads?
It depends entirely on format. Single image ads typically run around 1%, while document ads (around 6%), multi-image (around 6.6%), video (around 5.6%), and thought leader ads (around 5% and often higher) run much higher. A 5%-plus figure is often called “good,” but that mostly reflects social formats. The most useful benchmark is your own account’s trend over time, compared format to format.
Q2. How is LinkedIn ads engagement rate calculated?
Engagement rate is total engagements divided by impressions, where engagements include clicks plus reactions, comments, shares, follows, and “see more” expansions. For example, 900 total interactions on 50,000 impressions is an engagement rate of 1.8%. Because it counts social actions on top of clicks, it is always higher than click-through rate for the same ad, and you can find it in Campaign Manager under the Engagement column view.
Q3. What counts as an engagement on LinkedIn ads?
LinkedIn counts a broad set of interactions: chargeable clicks to your landing page or lead form, social clicks such as likes, comments, and shares, “see more” expansions of the intro text, clicks to view more of a carousel or document, clicks to your company page, and follows. Any of these counts toward engagement rate, which is why it is the broadest measure of whether an ad is resonating at all.
Q4. What is the difference between engagement rate and CTR?
Click-through rate counts only chargeable clicks divided by impressions, so it measures the paid action, typically 0.44% to 0.65% for sponsored content. Engagement rate counts those clicks plus every social action, so it is always higher and measures overall resonance. Use CTR to judge traffic and cost, and engagement rate to diagnose creative. Neither tells you whether the lead was qualified.
Q5. Why is my LinkedIn ads engagement rate high but I get no leads?
Because engagement is attention, not intent, and not all engagements are equal. An ad can collect reactions, comments, and “see more” clicks while the people engaging are not buyers, or while your offer, landing page, or targeting fails to convert the ones who are. High engagement with low conversion points you to the offer and the audience, not the ad. Check that the landing page delivers what the ad promised and that the targeting matches your buyer.
Q6. Does engagement rate affect how much you pay on LinkedIn?
Yes, indirectly. LinkedIn ranks ads on bid multiplied by relevance, and relevance is built partly from predicted engagement. An ad that earns strong engagement signals high relevance, which raises its ad rank and lets it win the auction at a lower bid, lowering your effective cost per click. A weak engagement rate drags the relevance score down and raises your costs, so improving the ad is often a better cost lever than raising the bid.
Q7. How do you improve LinkedIn ads engagement rate?
Match the creative tightly to one specific audience, lead with a strong hook in the first line before the “see more” cut-off, and test formats that naturally earn social actions like thought leader ads, document ads, and video. Keep audiences tight so the ad reaches the people it was written for, and refresh creative every three to four weeks before fatigue sets in. These lift relevance as well as engagement, so the benefit shows up in cost.
Q8. Is engagement rate a vanity metric?
It can become one if you treat it as the goal, because high engagement with no pipeline is just entertainment, and likes and “see more” clicks signal little about buying. But it is not purely vanity like a follower count, because it feeds your relevance score and affects your cost per click. The right use is as a diagnostic for creative quality, read alongside conversion, while you judge the campaign on cost per qualified lead and pipeline.
More Featured Blogs
View All Blogs
LinkedIn Ads on a Small Budget: How to Make It Work


LinkedIn Ads Bidding Strategies: Maximum Delivery vs Cost Cap vs Manual
LinkedIn Ads Campaign Structure: How to Organize for Scale